In a statistically unlikely turn of events, I have become very good friends with my next door neighbors. One of them is a hobbyist beer brewer, and I’ve been joining him on a few weekends to help out and learn about beer making.
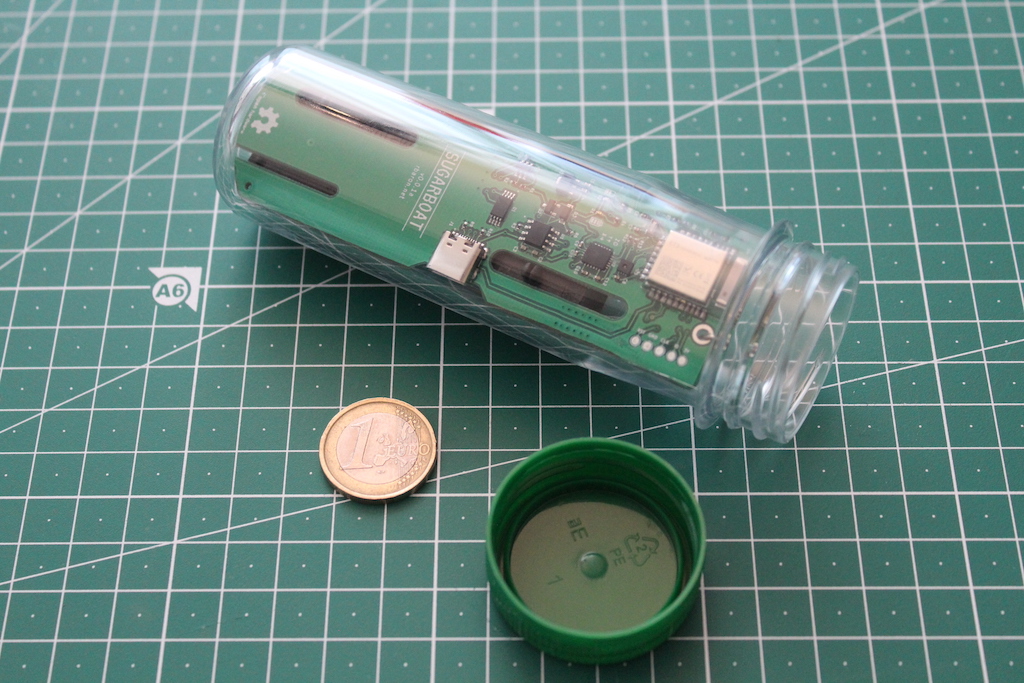 Sugarboat in a preformed PET bottle container
A crucial part of it is turning sugar into alcohol – the fermentation. The yeast feeds on malt sugars to produce alcohol and carbon dioxide.
A hydrometer is a tool that measures the density of a liquid. From the density, we can approximate the sugar content of the pre-fermentation solution and estimate the alcohol content of the beer at the end of the process.
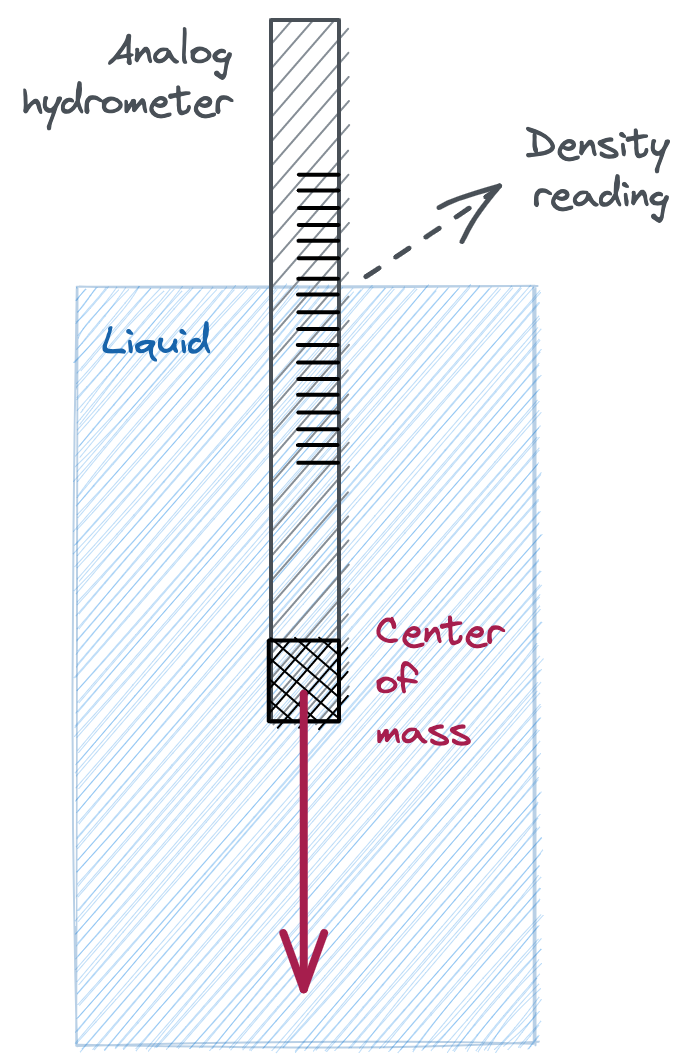 Working principle of an analog hydrometer
We know that denser solutions will cause the hydrometer to float higher, and the scale on the hydrometer gives us the density reading.
Some digital hydrometers on the market (e.g.: Tilt in the US, Float from the Netherlands, DIY iSpindel) use a similar approach:
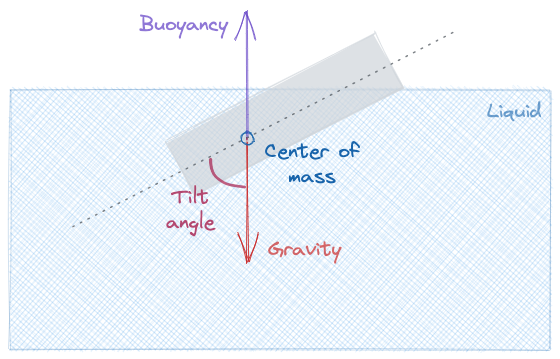 Working principle of some digital hydrometers
Shifting up the center of mass causes the hydrometer to float at an angle. The denser the solution, the larger the tilt angle. In contrast to vertical displacement in analog hydrometers, the tilt angle is easy to read digitally with an accelerometer.
I put these principles together in Sugarboat, an open source digital hydrometer:
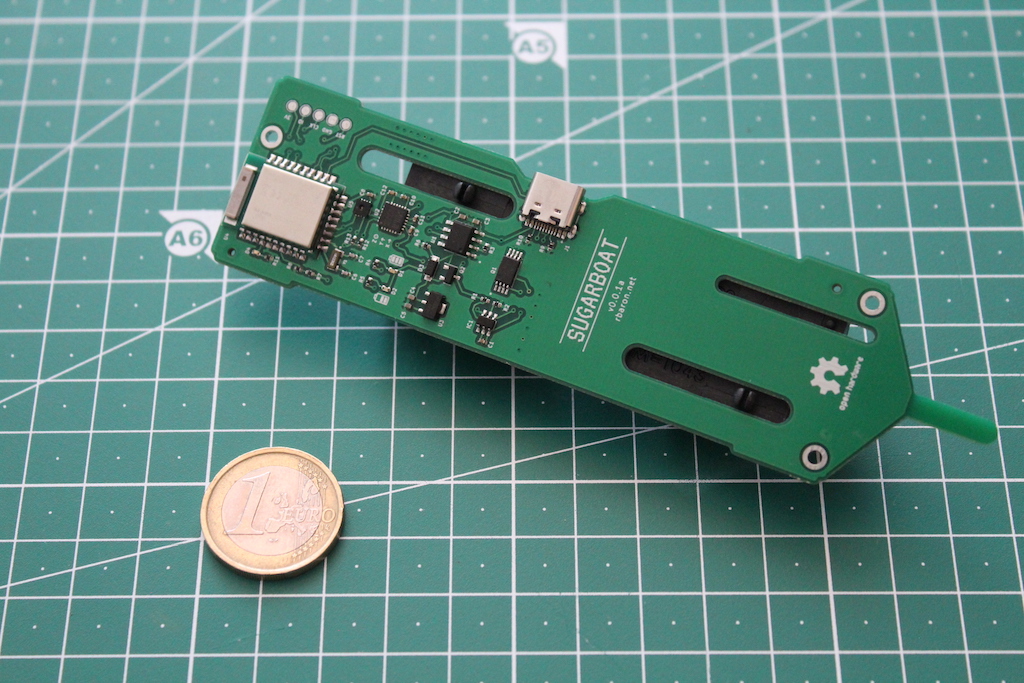 Front
Front
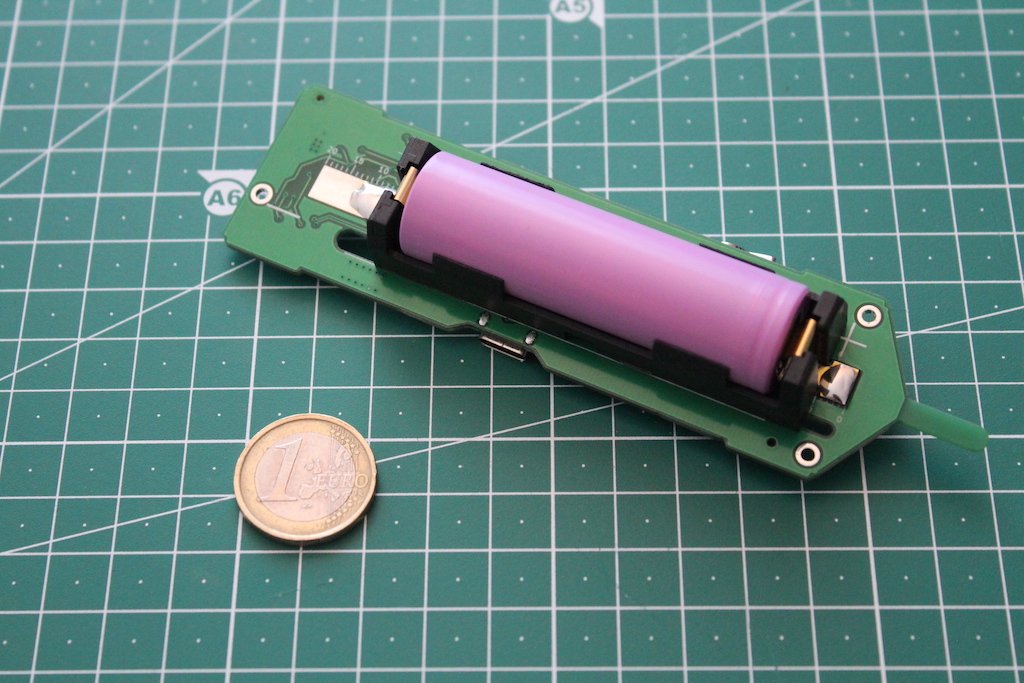 Back
Back
To calibrate it, I start with a pure water solution and slowly add sugar to it. I collect pairs of tilt angle vs. sugar concentration, while maintaining the temperature constant, and fit a polynomial to the curve:
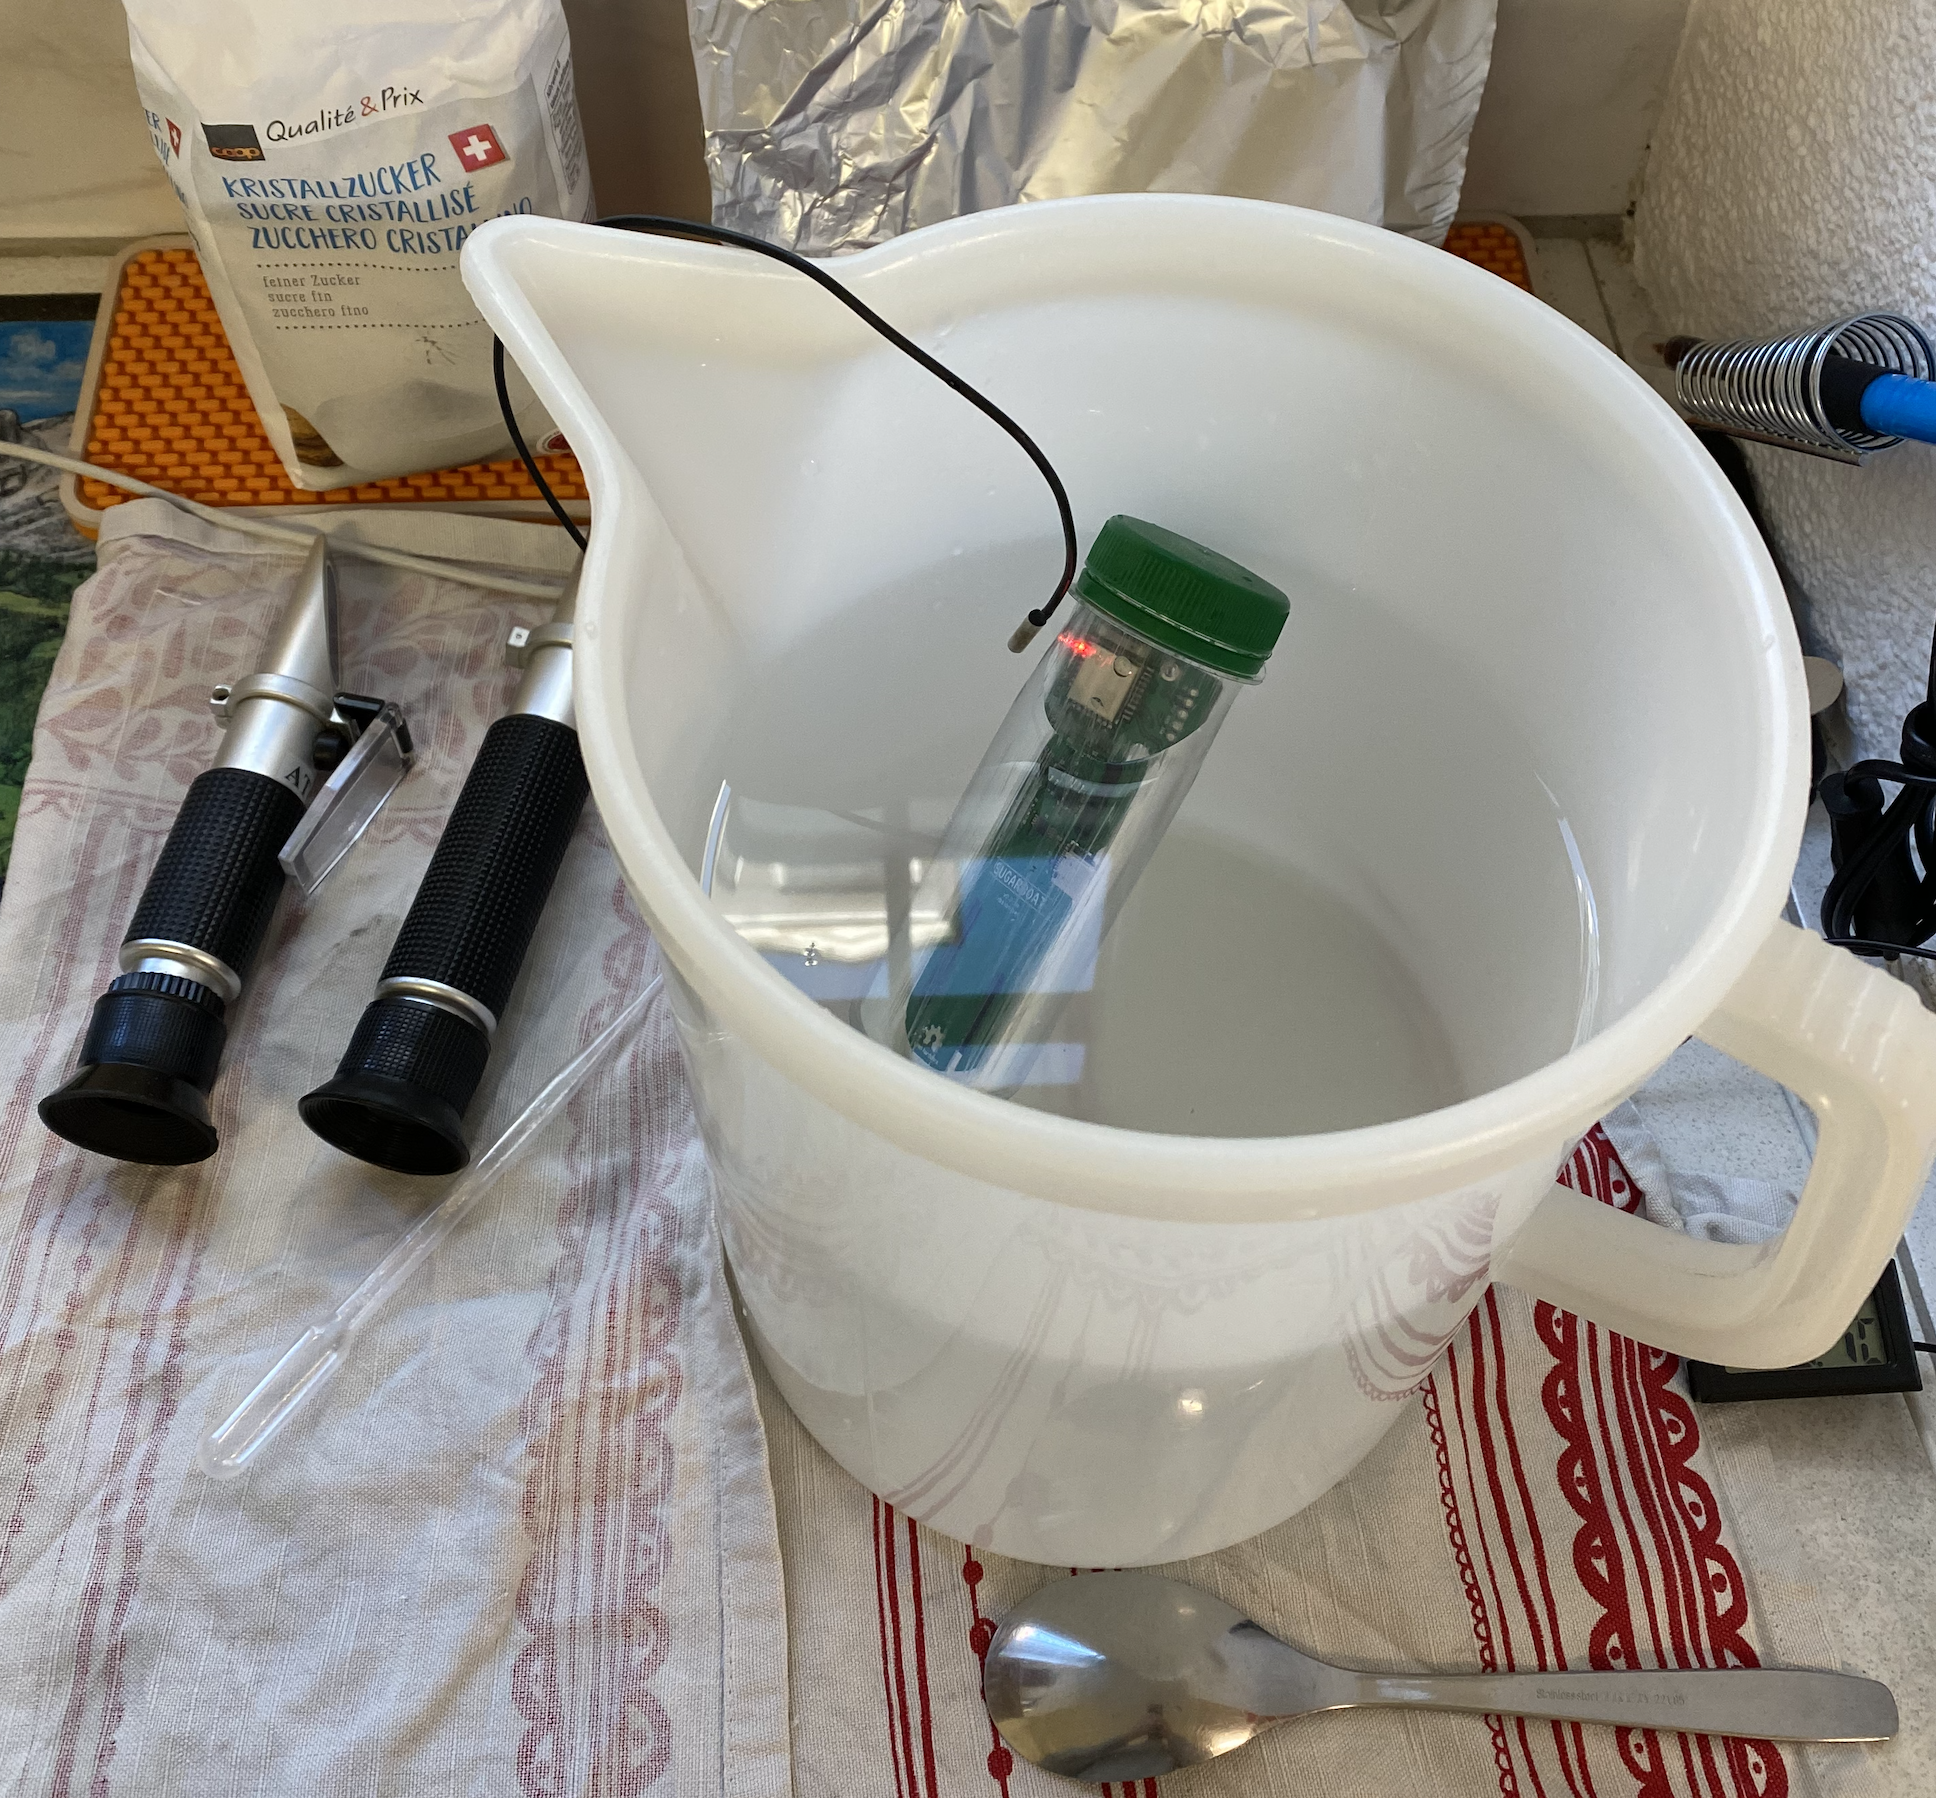 Calibration process
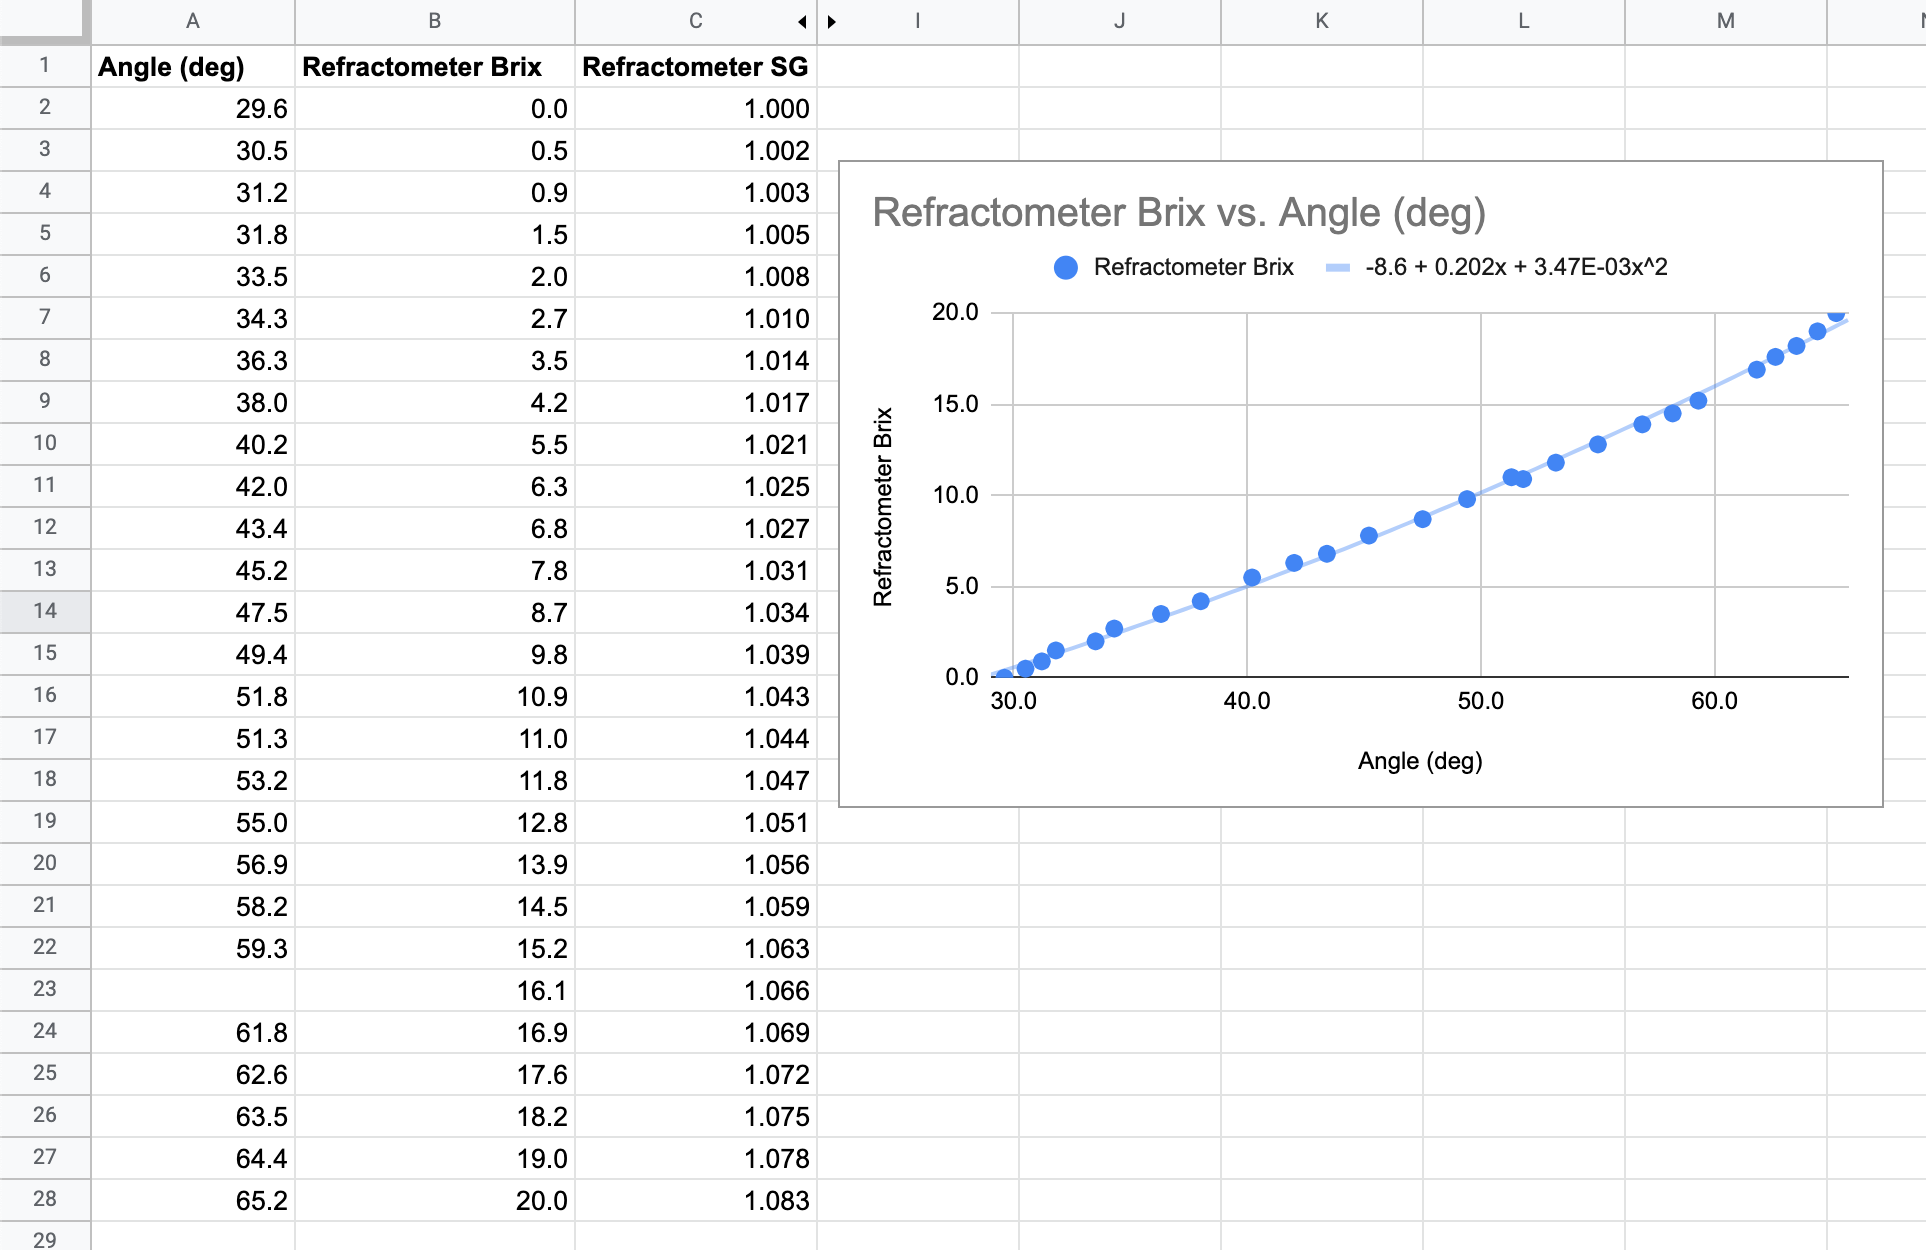 Fit polynomial curve
Sugarboat talks Bluetooth Low Energy (BLE), and I built a web interface to both upload the calibration coefficients and see real time data:
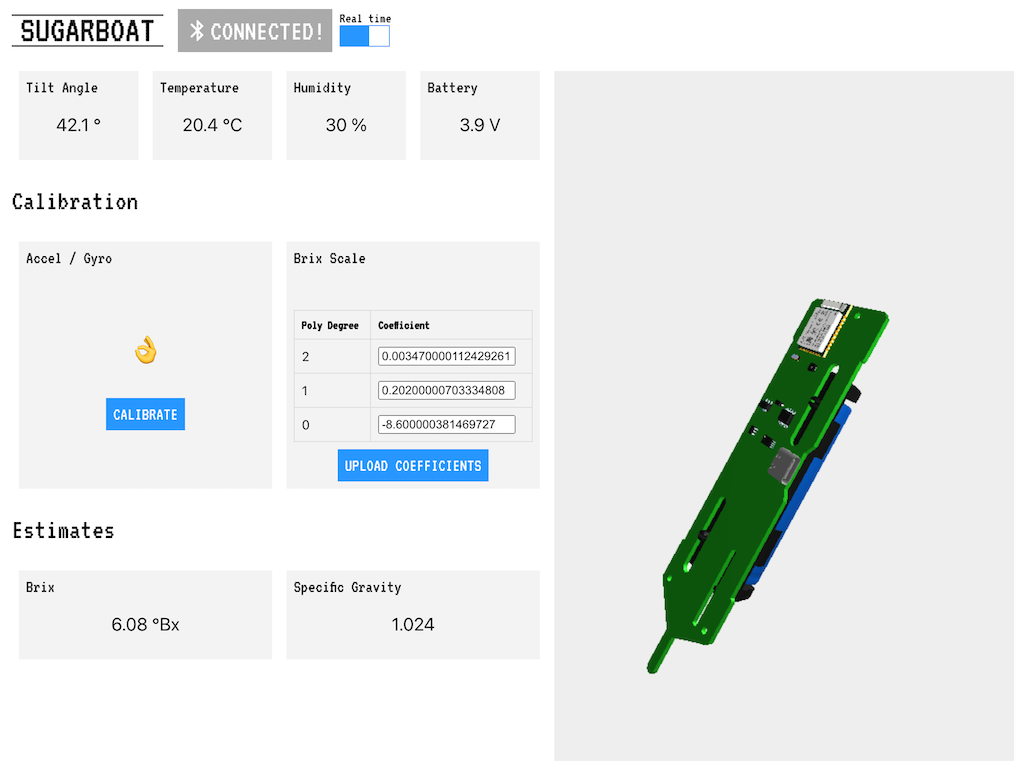 Web UI
A realtime experiment
The beer making room doesn’t get internet. I built a BLE-LoraWAN bridge that connects to the Sugarboats via Bluetooth and sends their readings through The Things Network:
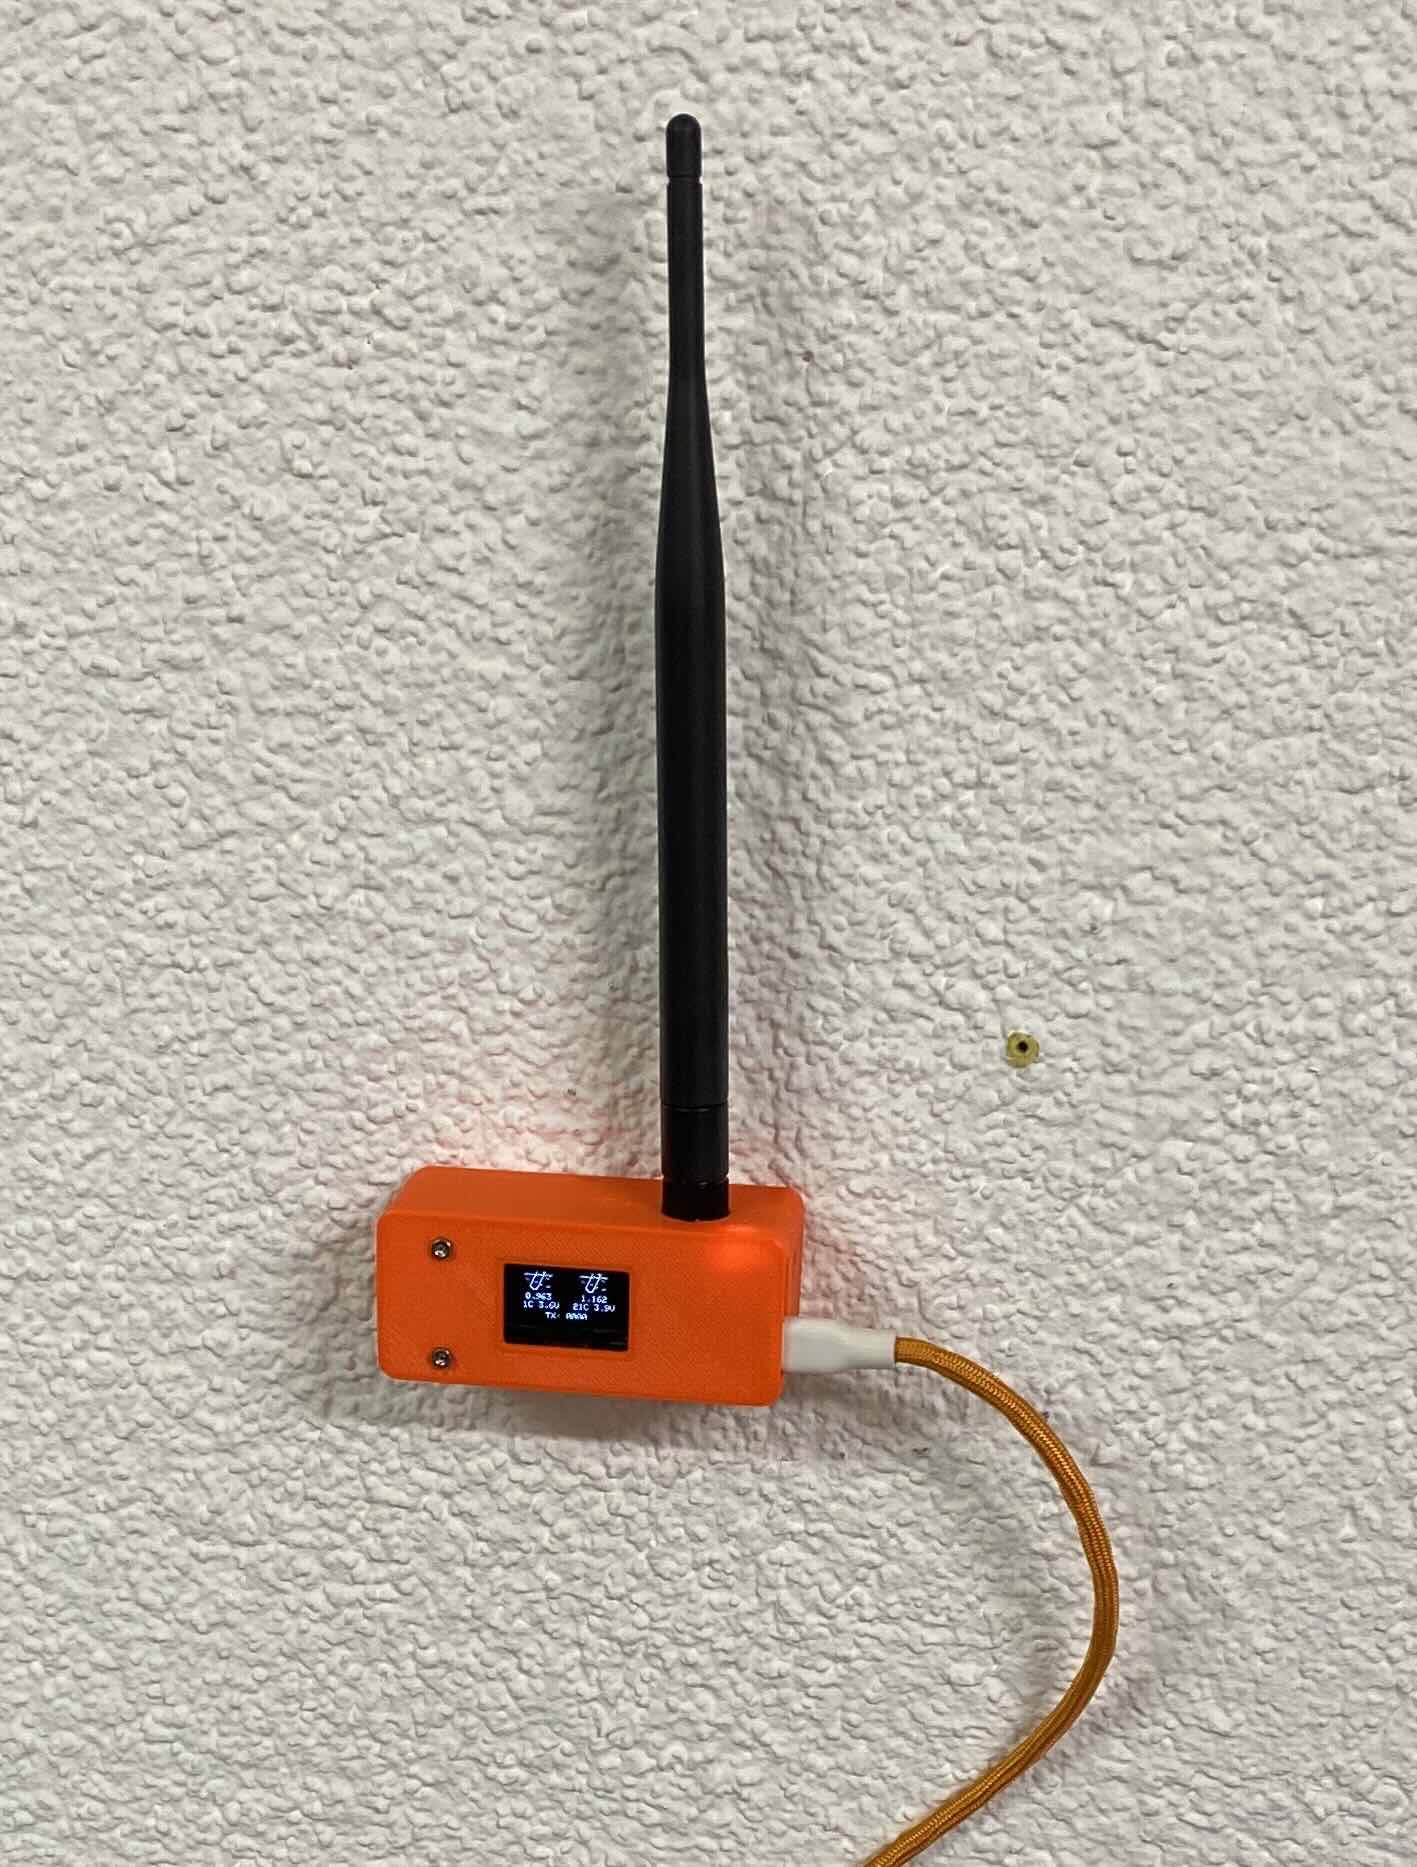 LoraWAN bridge
Bridge OLED animations
To get those readings into Home Assistant for remote monitoring and alerting, I wrote rbaron/ha-sugarboat-mqtt-bridge:
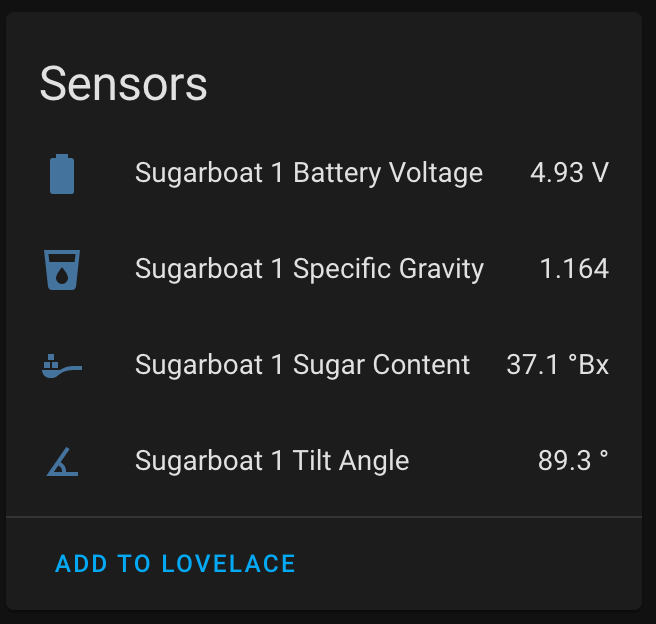 Home Assistant integration – Sugarboat 1 was charging while laying flat on the table
Here’s an example of a batch:
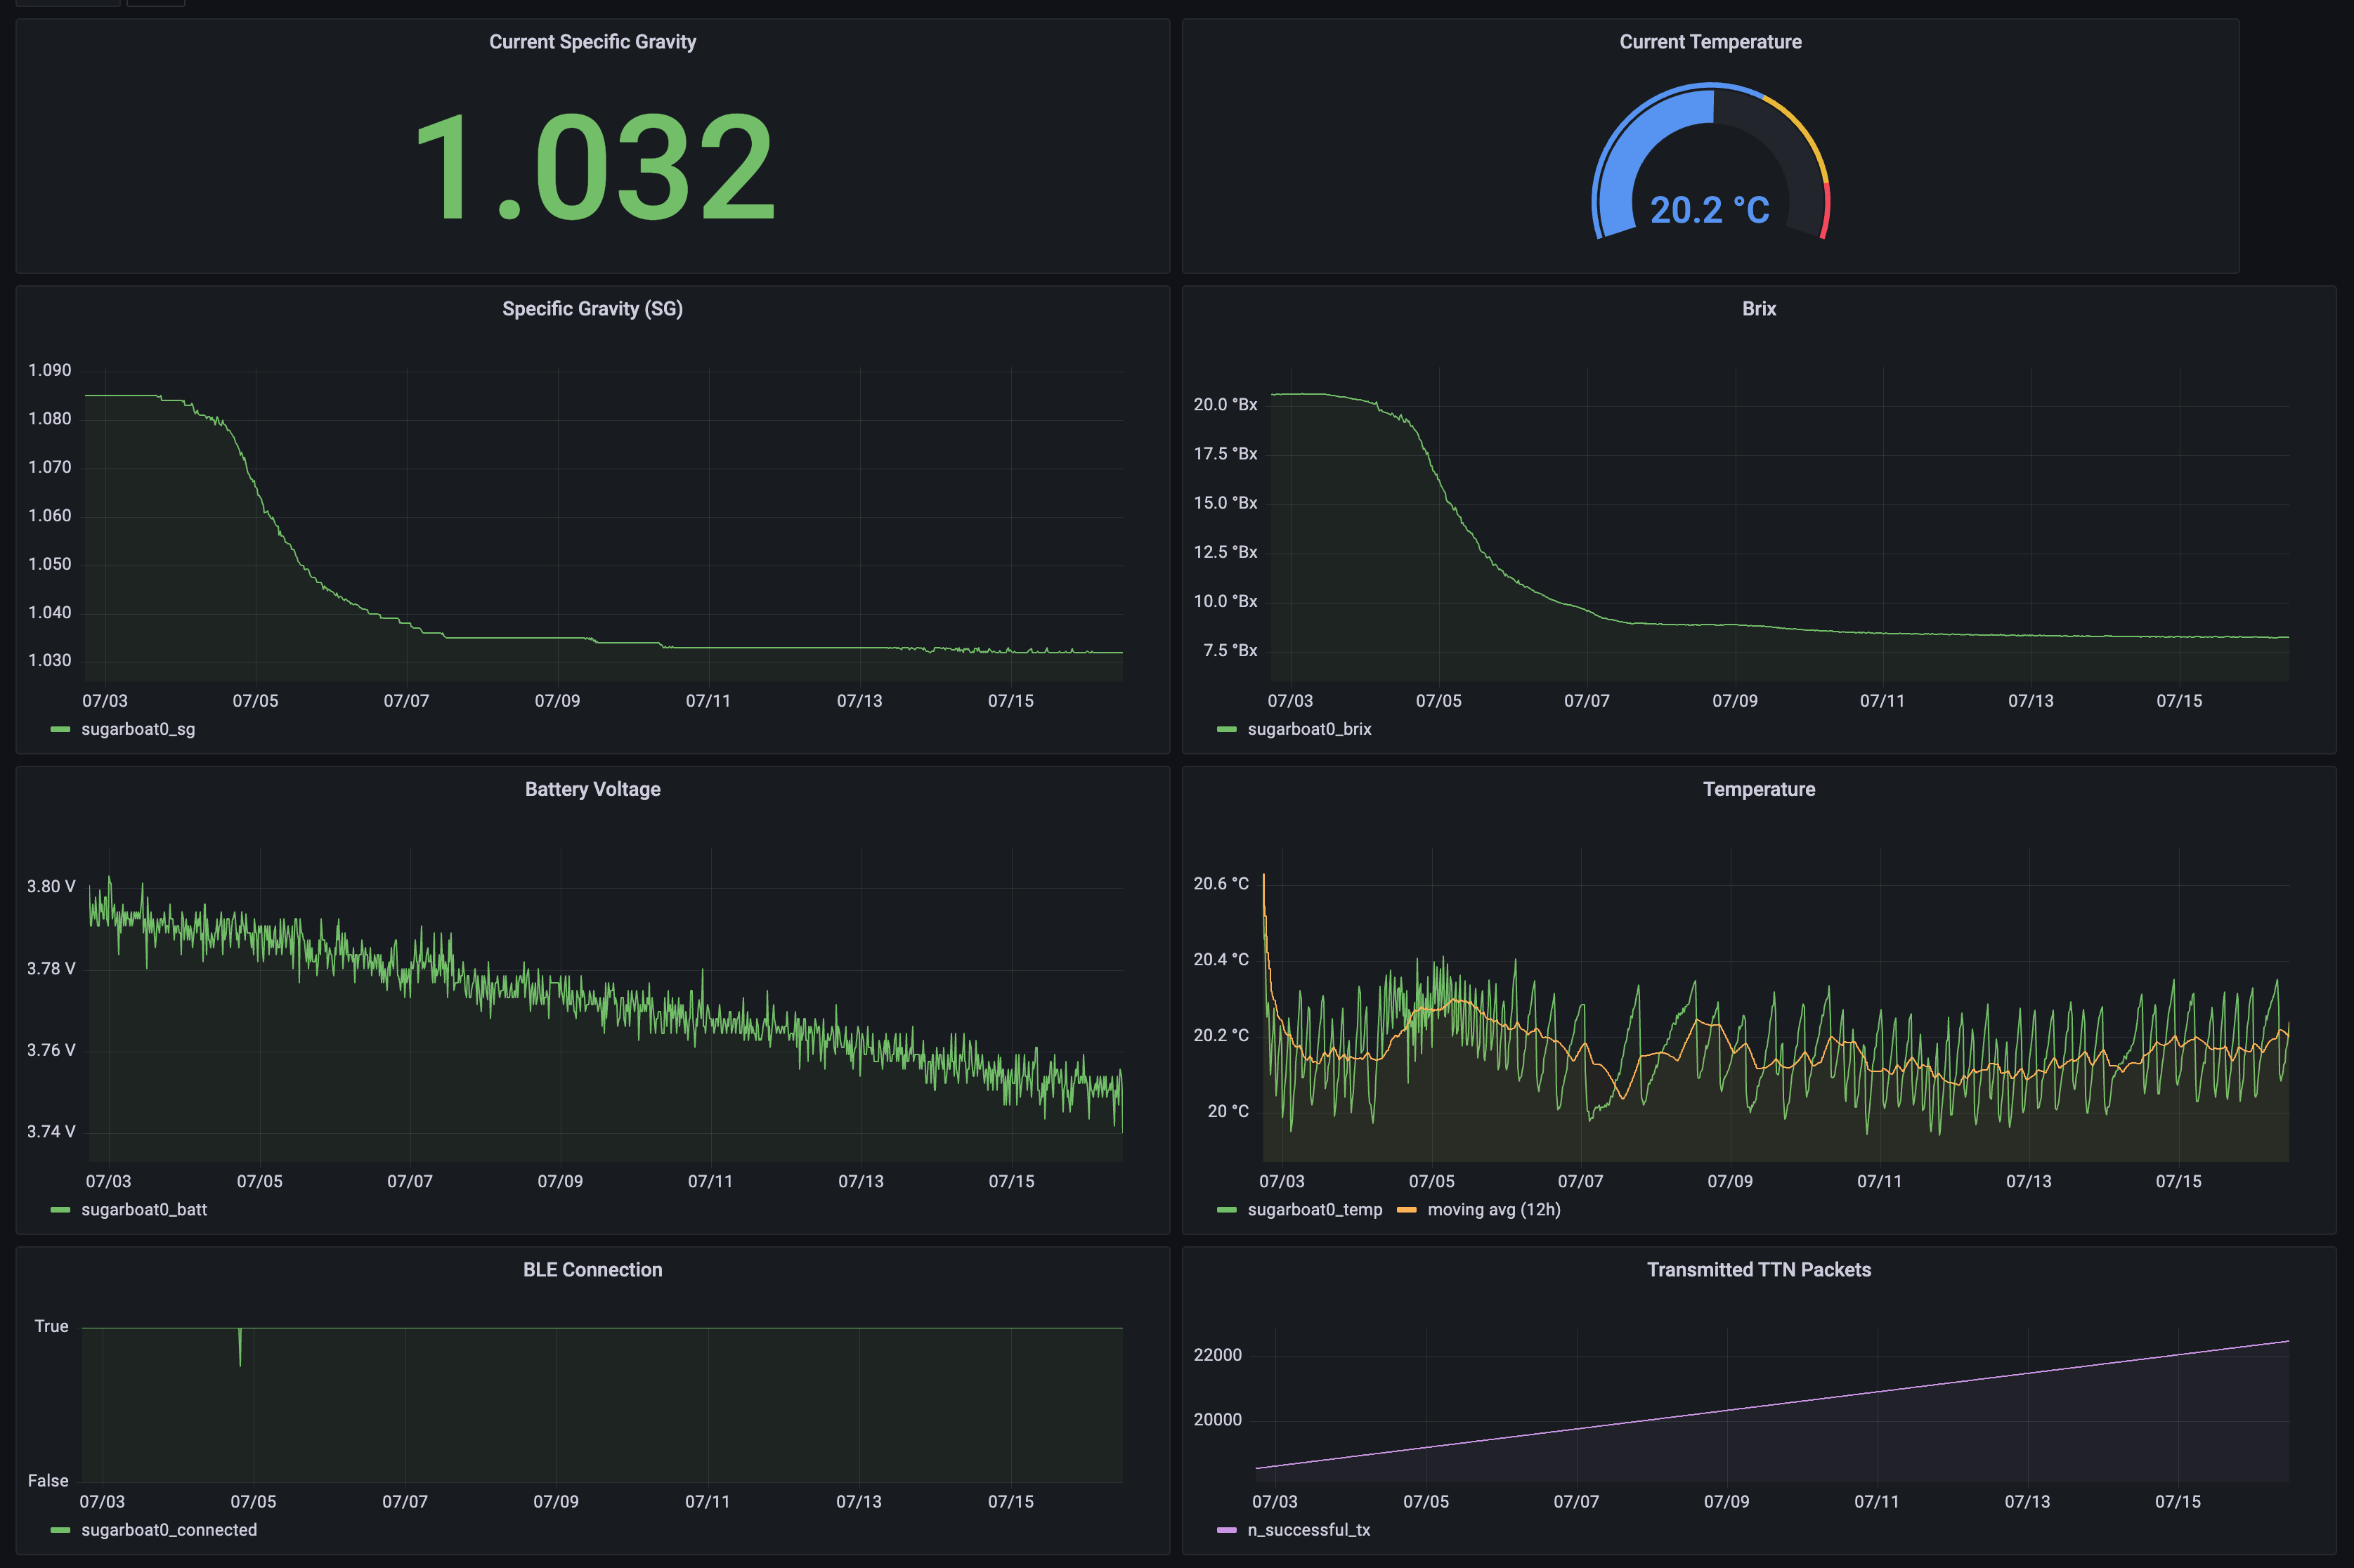 A 2-week fermentation process
On the top left chart, the Specific Gravity (SG) shows how the density changes as the yeast processes sugar into alcohol. Once the curve is flat, the beer is ready for bottling.
To estimate the final alcohol content, we can use the ABV estimate formula. In this particular case:
- Original gravity: 1.085
- Final gravity: 1.032
- Alcohol by volume: